The new look and feel of the SAS BI Dashboard Ver 4.3 leaves you Awe struck, this time SAS have come up with something extra ordinary and Out of the box. The great news is that this time the Dashboard have a lots of Interactive features which the end user would love to see it, though the earlier version of the Dashboard have some interactivity which come with a lot of coding in the background.
However this time around SAS has given an option for the Developers to set the Stored Process as a data source to the dashboards which helps us in leveraging the power of the SAS Stored process with the Dashboard.
The stored process which needs to be created for the Dashboards are somewhat different than the ones that are used for other applications let us find out how.
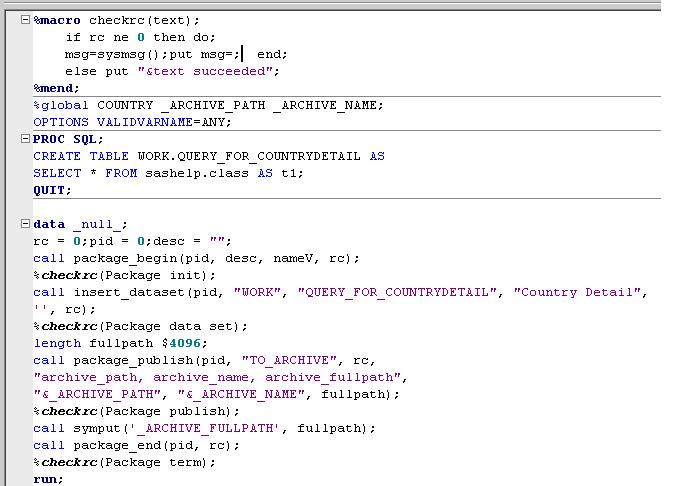
Let us look at this sample code.
In this code the dataset is being published (Please refer to SAS Publication framework for more information ) to an implicit location. The published package will be in .SPK format, and you can publish multiple datasets to the same Package. Make sure that the Stored process macros (%STPBEGIN,%STPEND) have been turned off.
Let us now see how to access the stored process from the Dashboard Interface
In the SAS BI Dashboard Go to File ->

New -> Indicator Data.
Select 'Stored Process' as the data source and select your stored process.
In this example you can see that there are multiple datasets that are being published by the Stored Process.
Reference:
Match Made in Heaven: Predictive Analytics and the SAS® BI Dashboard 4.3 support.sas.com/resources/papers/proceedings11/047-2011.pdf
Interactive Dashboards: Powered by Flash and the SAS® Programmer
support.sas.com/resources/papers/proceedings10/045-2010.pdf